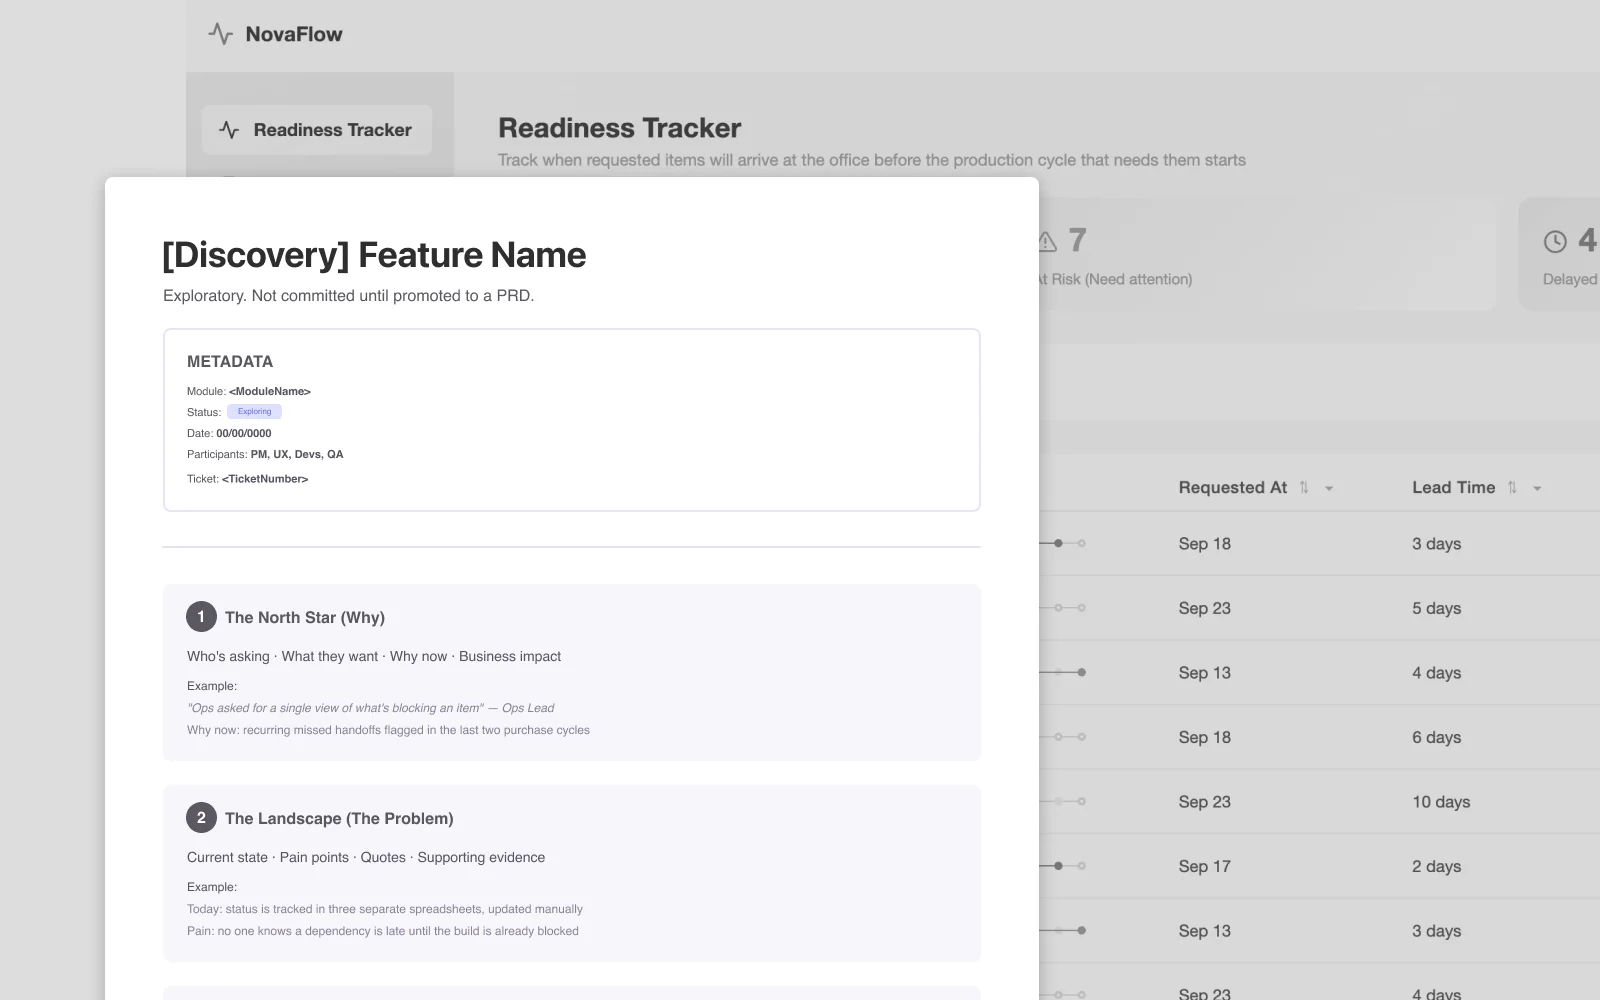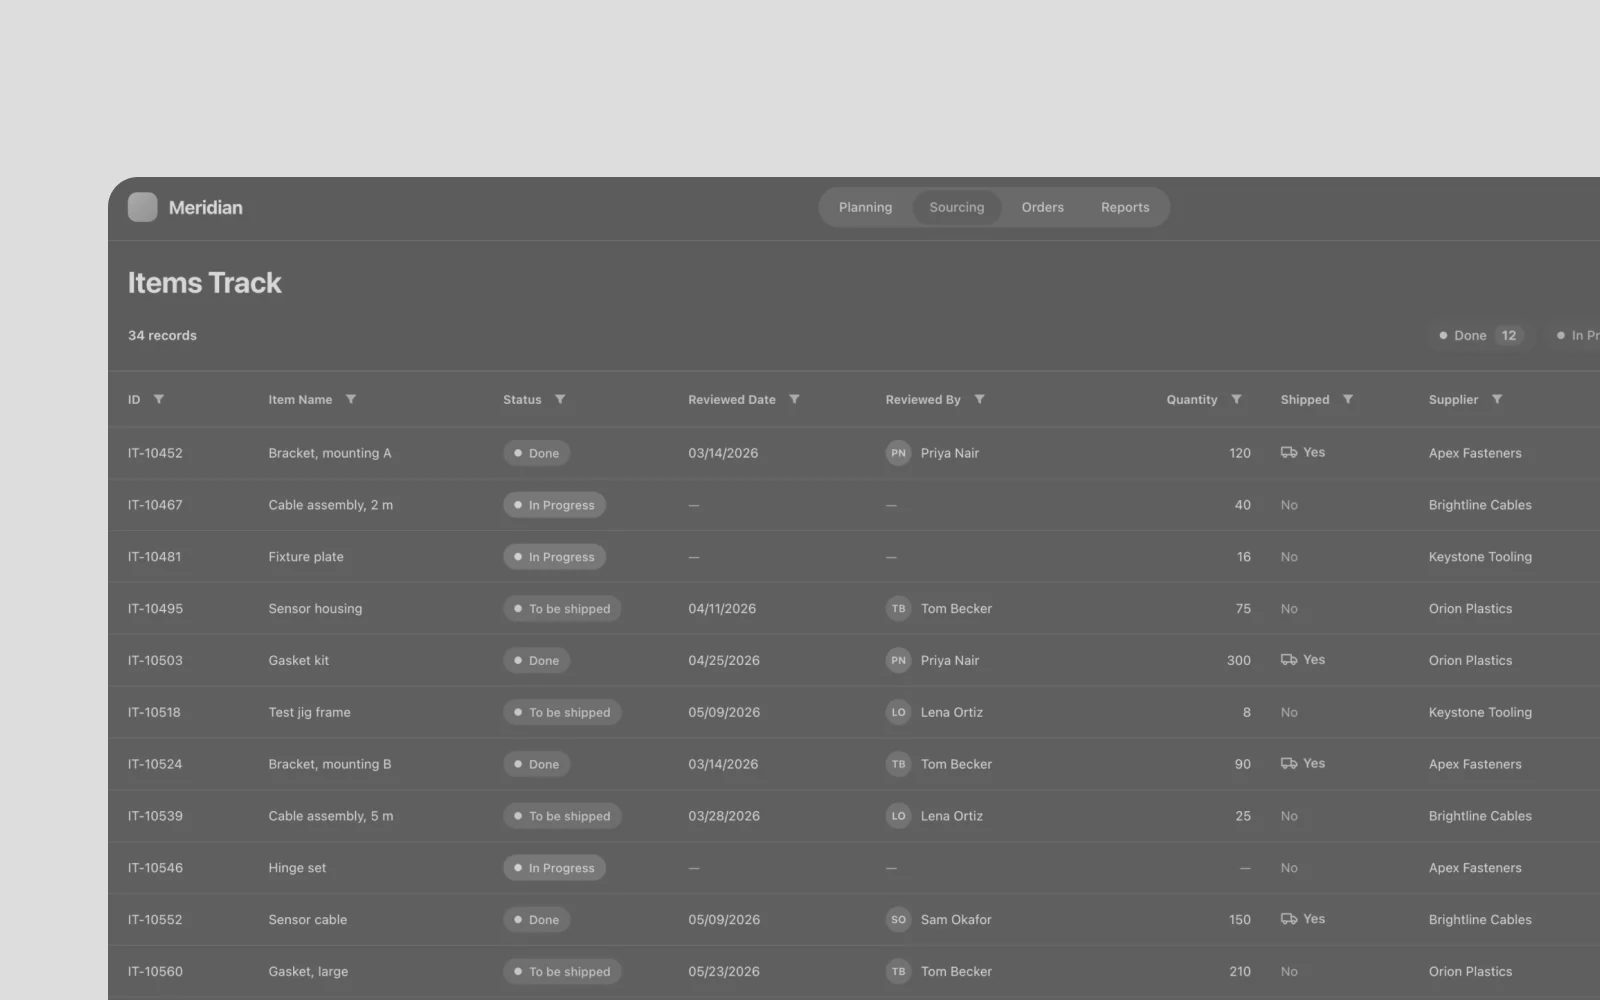
Project Overview
- Project
- UX Case Study
- Role
- Senior UX Designer
- Duration
- 1 mounth
- Status
- Real work, sensitive and identifying details removed
- Context
- Real project, anonymized (Meridian is a fictional name standing in for the actual platform; roles, pages, and fields are renamed)
Context & Challenge
Meridian is a fictional platform that helps sourcing, planning, and supplier teams manage purchases and deadlines for recurring production cycles. Its tables hold thousands of items. Filtering is how people find their rows. When it misleads them, the easy fallback is to export everything to Excel, which defeats the point of a single source of truth.
Users asked for a set of changes to the filters, based on what they kept running into:
- 01
Option lists that only show values present in the data.
- 02
Filtering one column should narrow the options in the other columns.
- 03
A way to exclude a value.
- 04
Dates listed as values to pick from, instead of a calendar.
They asked for these because they already use Excel for part of their work on Meridian. Excel’s filter is the one they know, so that is the behavior they expect from a column filter in the product.
I used those requests as the starting point: organize them into five concrete requests, and decide how each is validated.
Defining the Requests
The first step was turning user feedback into requests that could each be designed, shown, and checked. Each keeps the user’s original wording, so every change traces back to what a user asked for.
- Request #1
Searching the ID filter should match IDs only, not item names or suppliers
- Request #2
Group multiple values of one column into a single filter summary
- Request #3
Let users exclude: Not equal, Does not contain
- Request #4
Show key dates as a checklist, not a date picker
- Request #5
After filtering a column, show only related options in the others
Filter Structure
Every filter follows the same anatomy, from opening the funnel to clearing the result.
Entry point: A funnel icon in each filterable header.
Filter types follow the data: Multi-select with search for text and IDs, range for numbers, binary for on/off, a checklist for dates. Nullable columns add Show and Hide empty values. Number filters keep empty cells under Not equal, the same as text filters do. Every popover has Cancel and Apply. Applying with nothing selected removes that column’s filter, so a filter can be cleared from where it was set.
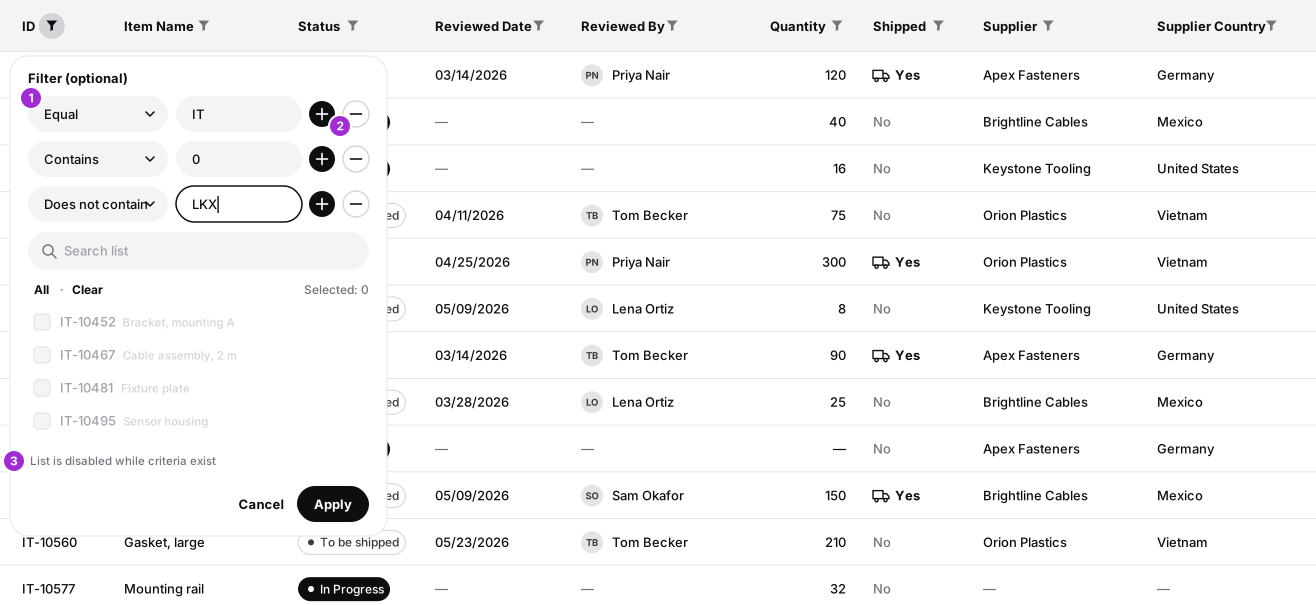
Criteria let users filter by a rule instead of ticking values from the list. The numbers match the markers in the image below.
- 1Operation selector
Equal, Not equal, Contains, or Does not contain, next to a search field.
- 2Add rows (+)
Equal and Contains rows combine with OR. Not equal and Does not contain rows combine with AND, so excluding two values removes both.
- 3Disabled list
While criteria exist, the checkbox list is disabled so the two methods can’t overwrite each other.
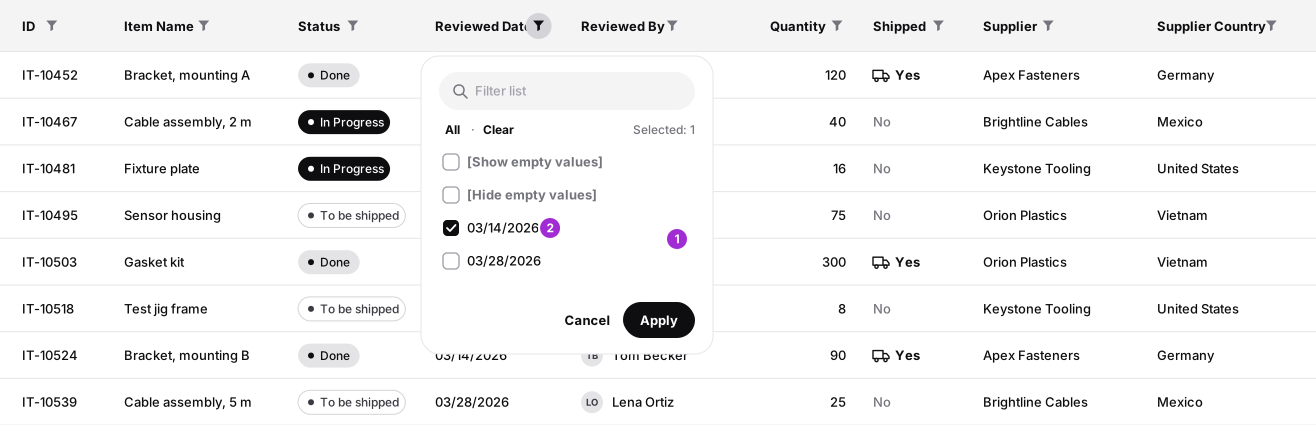
Key dates show as a searchable checklist, the same way Excel lists a date column’s values.
- 1Meridian checklist
Search, All, Clear, and a selected count. All and Clear act only on the values the search is showing, so a search never drops selections the user can’t see.
- 2Dates as values
Each date is listed as a value to tick, the way Excel lists a date column.
Summary bar: the record count sits on the left. Once filters are applied it reads “3 of 34 records”, so users see how much the filters narrowed the data. The filtered header is highlighted, and “Clear all” resets everything.
- 1Pill per column
One pill per filtered column, with its own count, such as ‘ID · 4’.
- 2Values on hover
Hovering a pill lists each value with its own remove button.

Validating It With Users
As the UX designer, I led a review with users that covered the five requests.
Each request was checked against a result users could see on screen:
Typing a partial ID matches IDs only, and for example, applying six selected IDs loads exactly those six.
Same values picked in one column collapse into a single pill with a count, and hovering it lists each value.
Not equal and Does not contain rows leave out the values they name.
A key date filters from a checklist and shows up as a pill with a count.
After filtering a column, the other option lists hold only related values.
The record count shows how many rows remain out of the total.
Removing any pill value updates the table.
Visualizing the Solution
The design artifact is an interactive prototype, the Items Track page, that shows all five requests working. Every column header has a funnel: search and tick values, stack criteria, choose Yes or No, show or hide empty cells, and watch the other columns’ options narrow as filters are applied.